“
I don't want to say what I paid for before this. Let's just say it rhymed with ‘unusual’ and leave it there. ThickPrints costs the same and actually shows me the stuff I trade, not options contracts I don't understand.
Anonymous
submitted via support chat
“
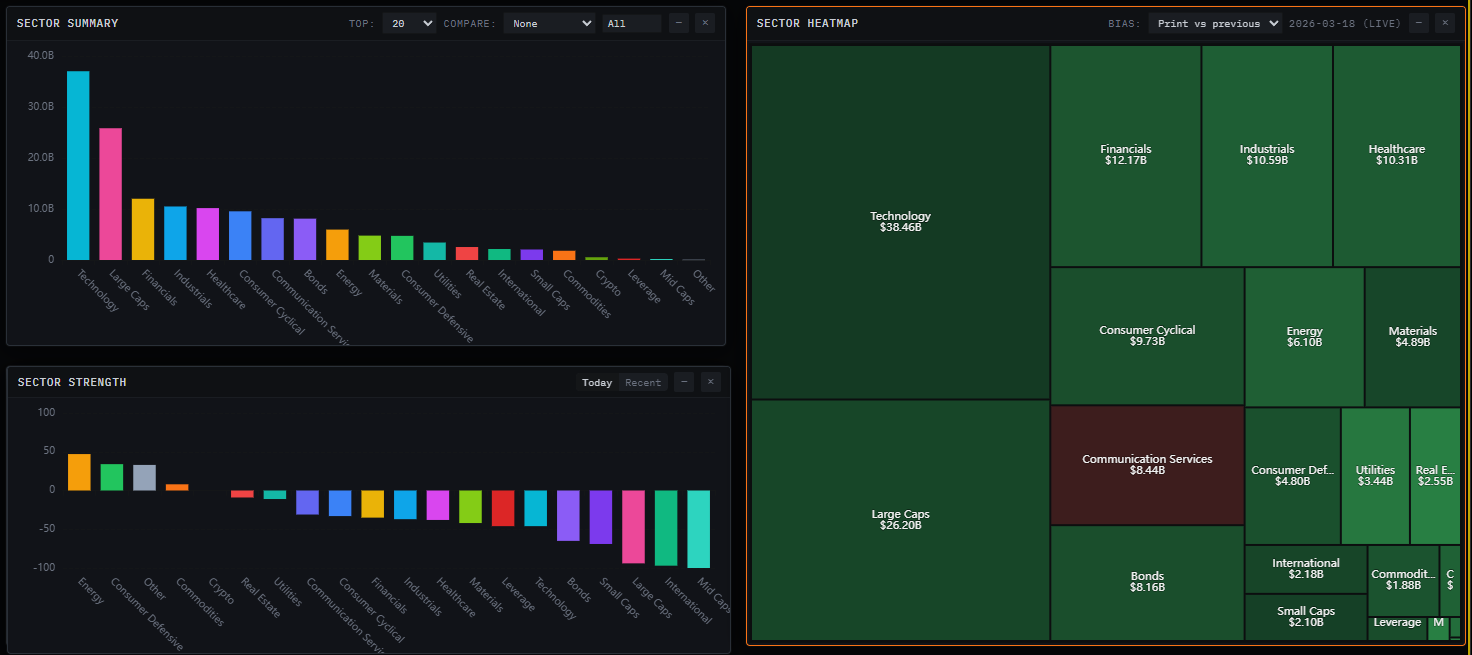
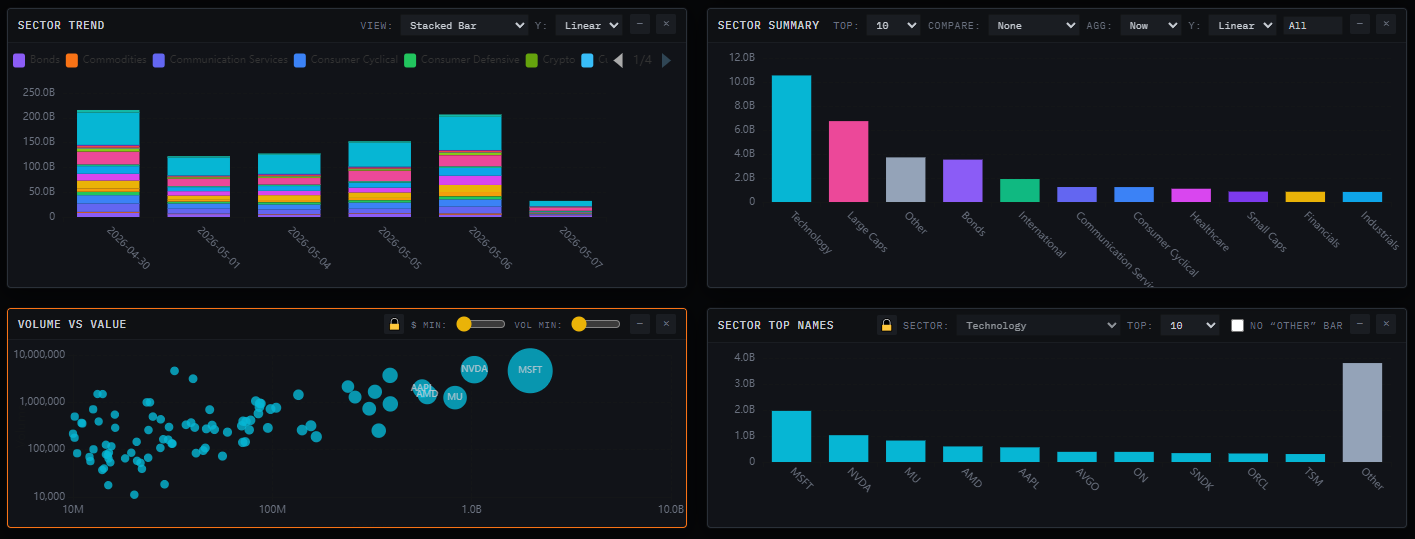
I'm not a stock picker. I trade sectors. The sector flow heatmap is the only place I've found where I can see in real time whether institutional block activity is rotating, not just reacting to news. It's been more useful than any macro newsletter I subscribe to.
Chris P.
macro-focused retail trader
“
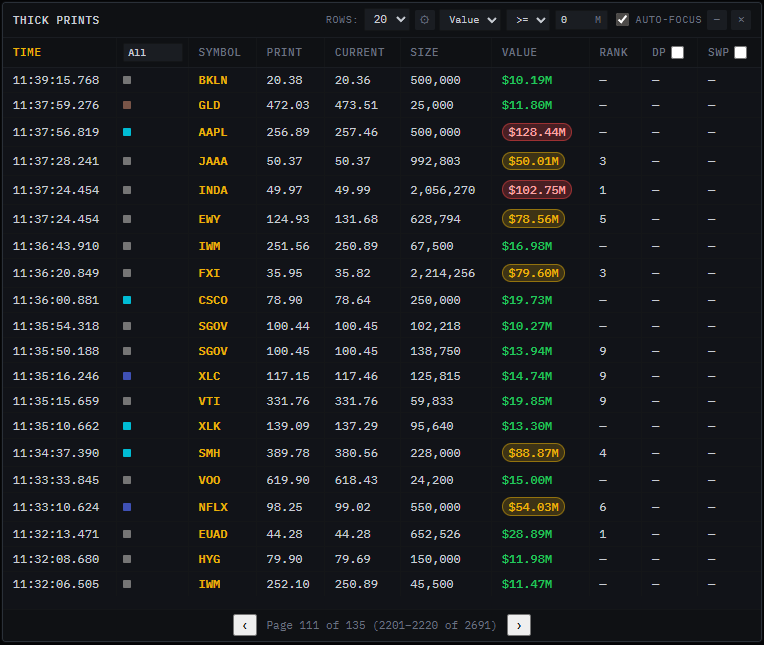
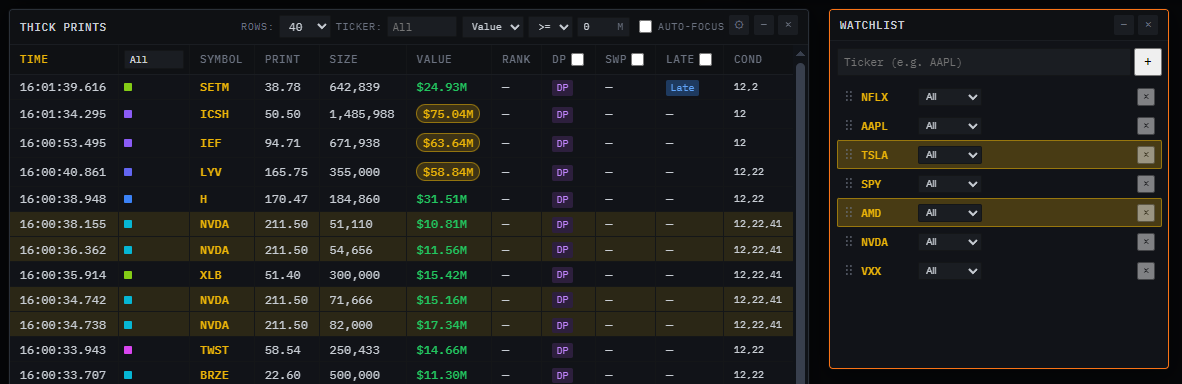
I only have about 30 minutes in the morning before work. I check the sector flow, scan the prints from the last hour, set my watchlist alerts, and I'm done. It's the most information-dense 30 minutes of my day.
Sandra W.
nurse, trades before and after shifts
“
I tracked my stats for six months before ThickPrints and six months after. Win rate went from 44% to 58% on my swing setups. I can't say it's entirely because of the platform but I also can't say it isn't. The one thing that changed was how I was confirming entries.
Greg F.
full-time trader, Florida
“
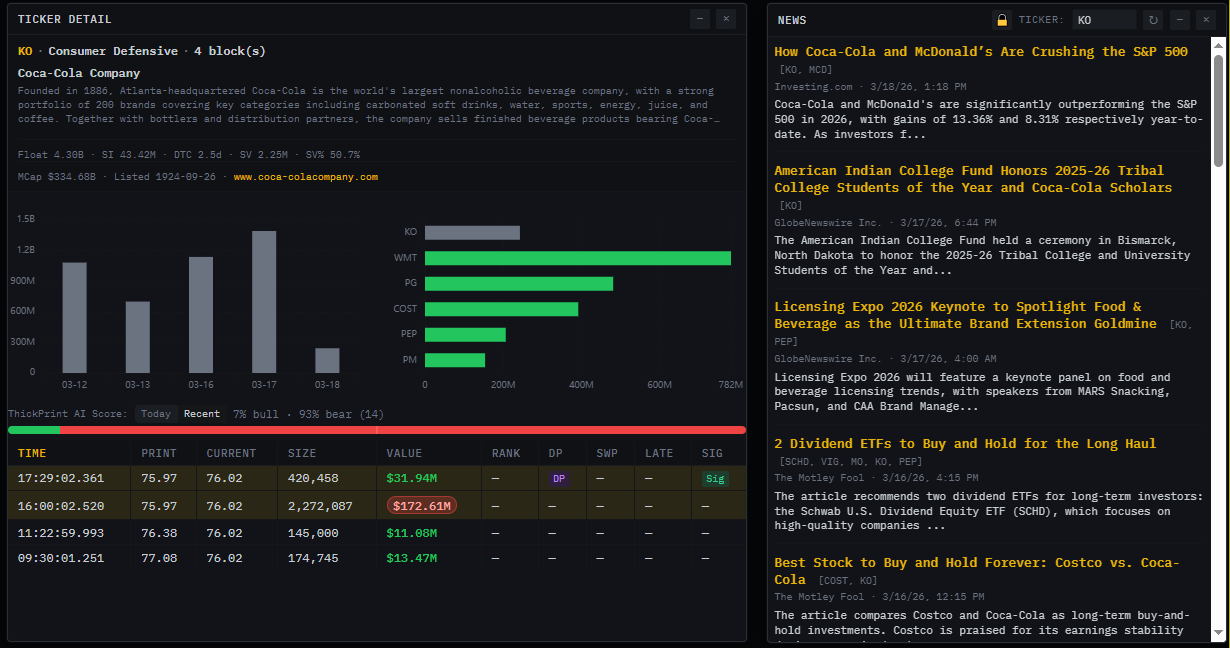
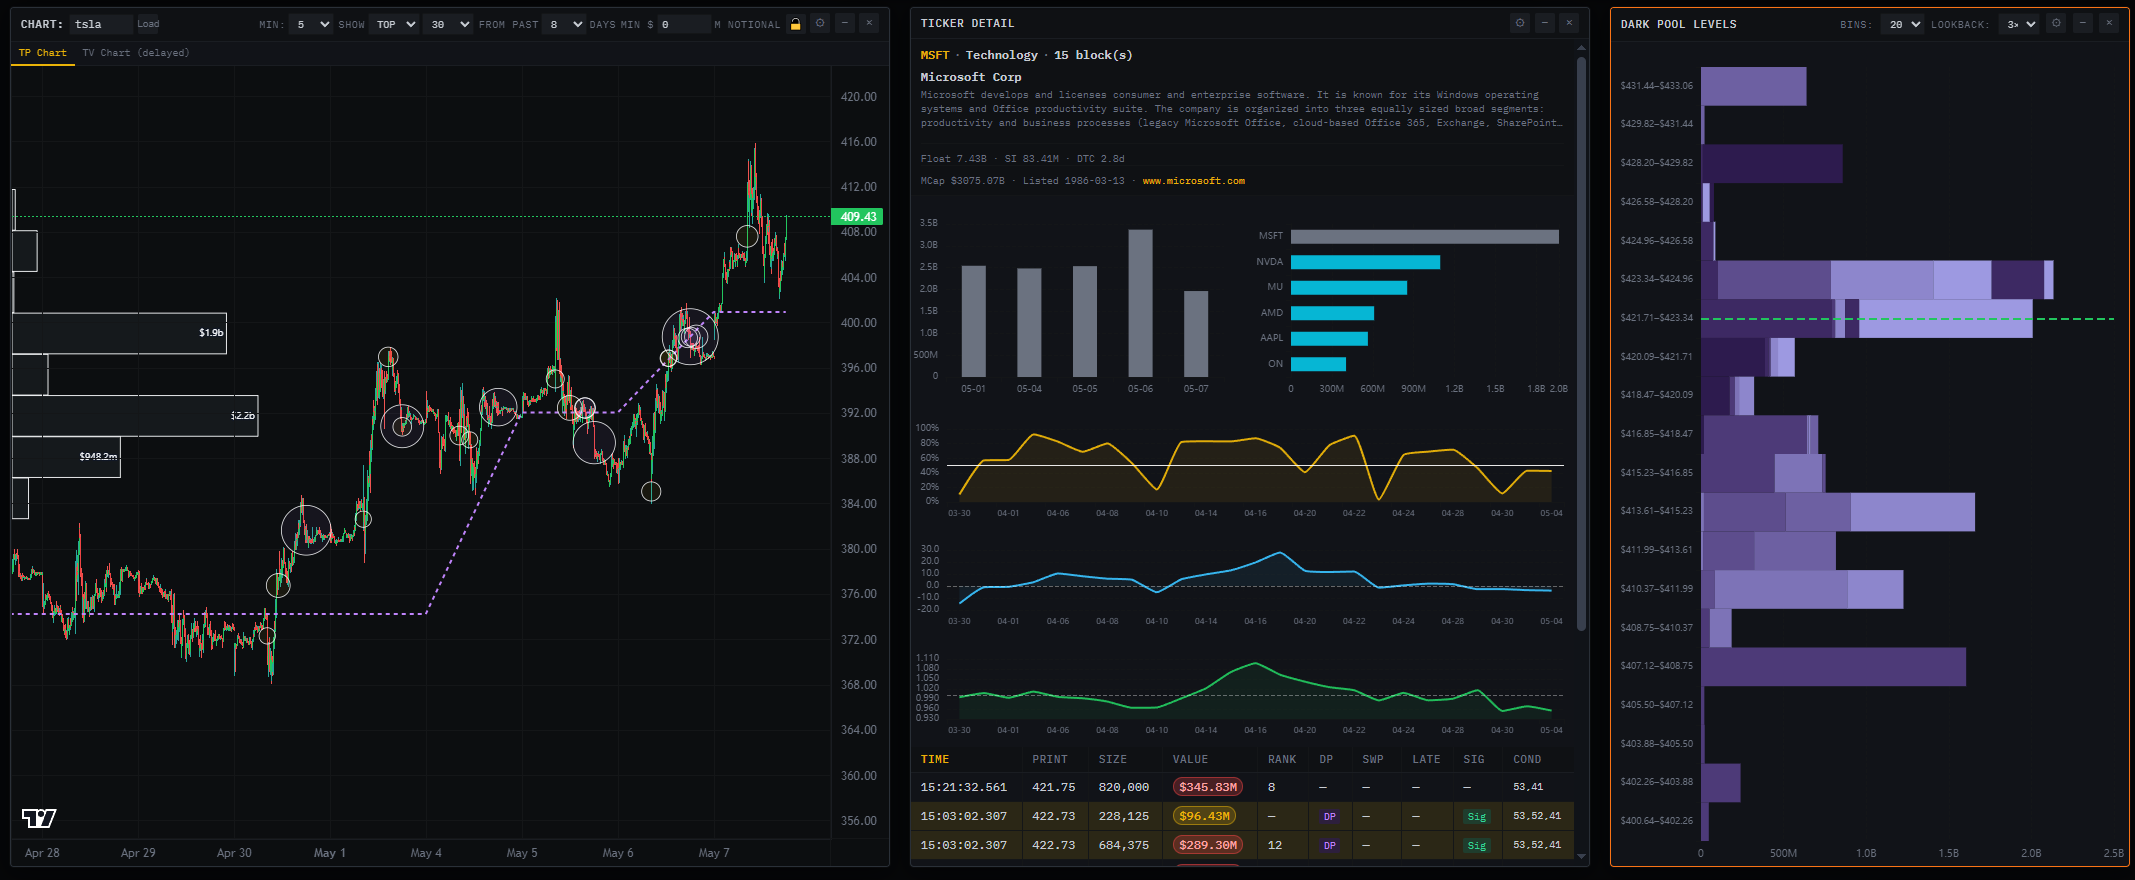
Dark pool levels became a core part of how I draw support and resistance. When I see a price level where $80M transacted off-exchange six weeks ago, and price comes back to test it, I take that level seriously. I've found it more reliable than most technical setups I used to draw.
Michelle T.
9 years trading experience
“
I want to be honest: I don't think block flow is alpha by itself. What it is, for me, is a noise filter. It tells me which names have real participation and which ones are just moving on air. That's worth $50 a month even if it never tells me a single direction.
Alan D.
algorithmic trader
“
I left three Discord groups in one year because the whole thing felt like performance. Everyone posting wins, nobody posting losses, and the ‘calls’ were really just picks after the move already happened. ThickPrints doesn't have an opinion. It just shows me the tape.
Jasmine N.
trader, New York
“
I'm probably not the typical user. I started using ThickPrints in my first year and I think it actually saved me from a lot of bad habits. I never had to unlearn chasing random signals because from the start I was trained to look for real size before I did anything.
Tyler K.
trading for 14 months
“
I run a small concentrated book — usually four to six names at a time. ThickPrints helps me add to winners with conviction. When I'm already long a name and I start seeing fresh dark pool prints at higher prices, that's all the confirmation I need to size up.
Rosa G.
portfolio-style retail trader
“
I've seen a lot of tools come and go in this industry. Most of them are selling you a feeling. ThickPrints sells you data. Clean, organized, real data. At my age I don't have time for feelings. I just want to know what's happening in the market and this thing tells me.
Bill C.
67, trading since 1998
“
I don't want to say what I paid for before this. Let's just say it rhymed with ‘unusual’ and leave it there. ThickPrints costs the same and actually shows me the stuff I trade, not options contracts I don't understand.
Anonymous
submitted via support chat
“
I'm not a stock picker. I trade sectors. The sector flow heatmap is the only place I've found where I can see in real time whether institutional block activity is rotating, not just reacting to news. It's been more useful than any macro newsletter I subscribe to.
Chris P.
macro-focused retail trader
“
I only have about 30 minutes in the morning before work. I check the sector flow, scan the prints from the last hour, set my watchlist alerts, and I'm done. It's the most information-dense 30 minutes of my day.
Sandra W.
nurse, trades before and after shifts
“
I tracked my stats for six months before ThickPrints and six months after. Win rate went from 44% to 58% on my swing setups. I can't say it's entirely because of the platform but I also can't say it isn't. The one thing that changed was how I was confirming entries.
Greg F.
full-time trader, Florida
“
Dark pool levels became a core part of how I draw support and resistance. When I see a price level where $80M transacted off-exchange six weeks ago, and price comes back to test it, I take that level seriously. I've found it more reliable than most technical setups I used to draw.
Michelle T.
9 years trading experience
“
I want to be honest: I don't think block flow is alpha by itself. What it is, for me, is a noise filter. It tells me which names have real participation and which ones are just moving on air. That's worth $50 a month even if it never tells me a single direction.
Alan D.
algorithmic trader
“
I left three Discord groups in one year because the whole thing felt like performance. Everyone posting wins, nobody posting losses, and the ‘calls’ were really just picks after the move already happened. ThickPrints doesn't have an opinion. It just shows me the tape.
Jasmine N.
trader, New York
“
I'm probably not the typical user. I started using ThickPrints in my first year and I think it actually saved me from a lot of bad habits. I never had to unlearn chasing random signals because from the start I was trained to look for real size before I did anything.
Tyler K.
trading for 14 months
“
I run a small concentrated book — usually four to six names at a time. ThickPrints helps me add to winners with conviction. When I'm already long a name and I start seeing fresh dark pool prints at higher prices, that's all the confirmation I need to size up.
Rosa G.
portfolio-style retail trader
“
I've seen a lot of tools come and go in this industry. Most of them are selling you a feeling. ThickPrints sells you data. Clean, organized, real data. At my age I don't have time for feelings. I just want to know what's happening in the market and this thing tells me.
Bill C.
67, trading since 1998